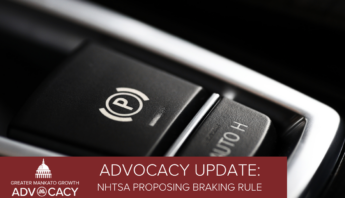
City Population Growth

In July, the State Demographic Center released their population estimates for cities and townships in Minnesota.

Below is a summary of the growth of all the cities in Blue Earth and Nicollet Counties:

City 2011 2015 2016 2011-2016 Growth Rate 2015-2016 Growth Rate
Eagle Lake city 2,482 2,932 3,067 18.13% 4.60%
Mankato city 39,628 41,727 42,803 5.30% 2.58%
Madison Lake city 1,033 1,170 1,183 13.26% 1.11%
Courtland city 606 635 641 4.79% 0.94%
North Mankato city 13,426 13,689 13,813 1.96% 0.91%
St. Peter city 11,459 11,784 11,807 2.84% 0.20%
Nicollet city 1,091 1,120 1,117 2.66% -0.27%
Le Sueur city 4,045 4,064 4,053 0.47% -0.27%
Lake Crystal city 2,540 2,554 2,542 0.55% -0.47%
Mapleton city 1,761 1,756 1,743 -0.28% -0.74%
St. Clair city 871 853 846 -2.07% -0.82%
Amboy city 533 525 517 -1.50% -1.52%
Vernon Center city 331 318 312 -3.93% -1.89%
Good Thunder city 580 551 540 -5.00% -2.00%
Skyline city 285 288 282 1.05% -2.08%
Pemberton city 248 239 233 -3.63% -2.51%

To provide some context of the growth, here is an analysis of how the larger cities within our two counties are growing:

City Growth rate Overall Growth Rank                         (Out of 857) Growth Rank – Cities with POP. 500+              (Out of 492) City Population rank in MN (Out of 857)
Eagle Lake city 4.60% 13 2 205
Mankato city 2.58% 46 25 21
Madison Lake city 1.11% 147 102 330
North Mankato city 0.91% 178 122 75
St. Peter city 0.20% 326 230 90
Le Sueur city -0.27% 501 322 172
Lake Crystal city -0.47% 568 370 228


Leave a Reply

Fill in your details below or click an icon to log in:

WordPress.com Logo

You are commenting using your WordPress.com account. Log Out /  Change )

Twitter picture

You are commenting using your Twitter account. Log Out /  Change )

Facebook photo

You are commenting using your Facebook account. Log Out /  Change )

Connecting to %s